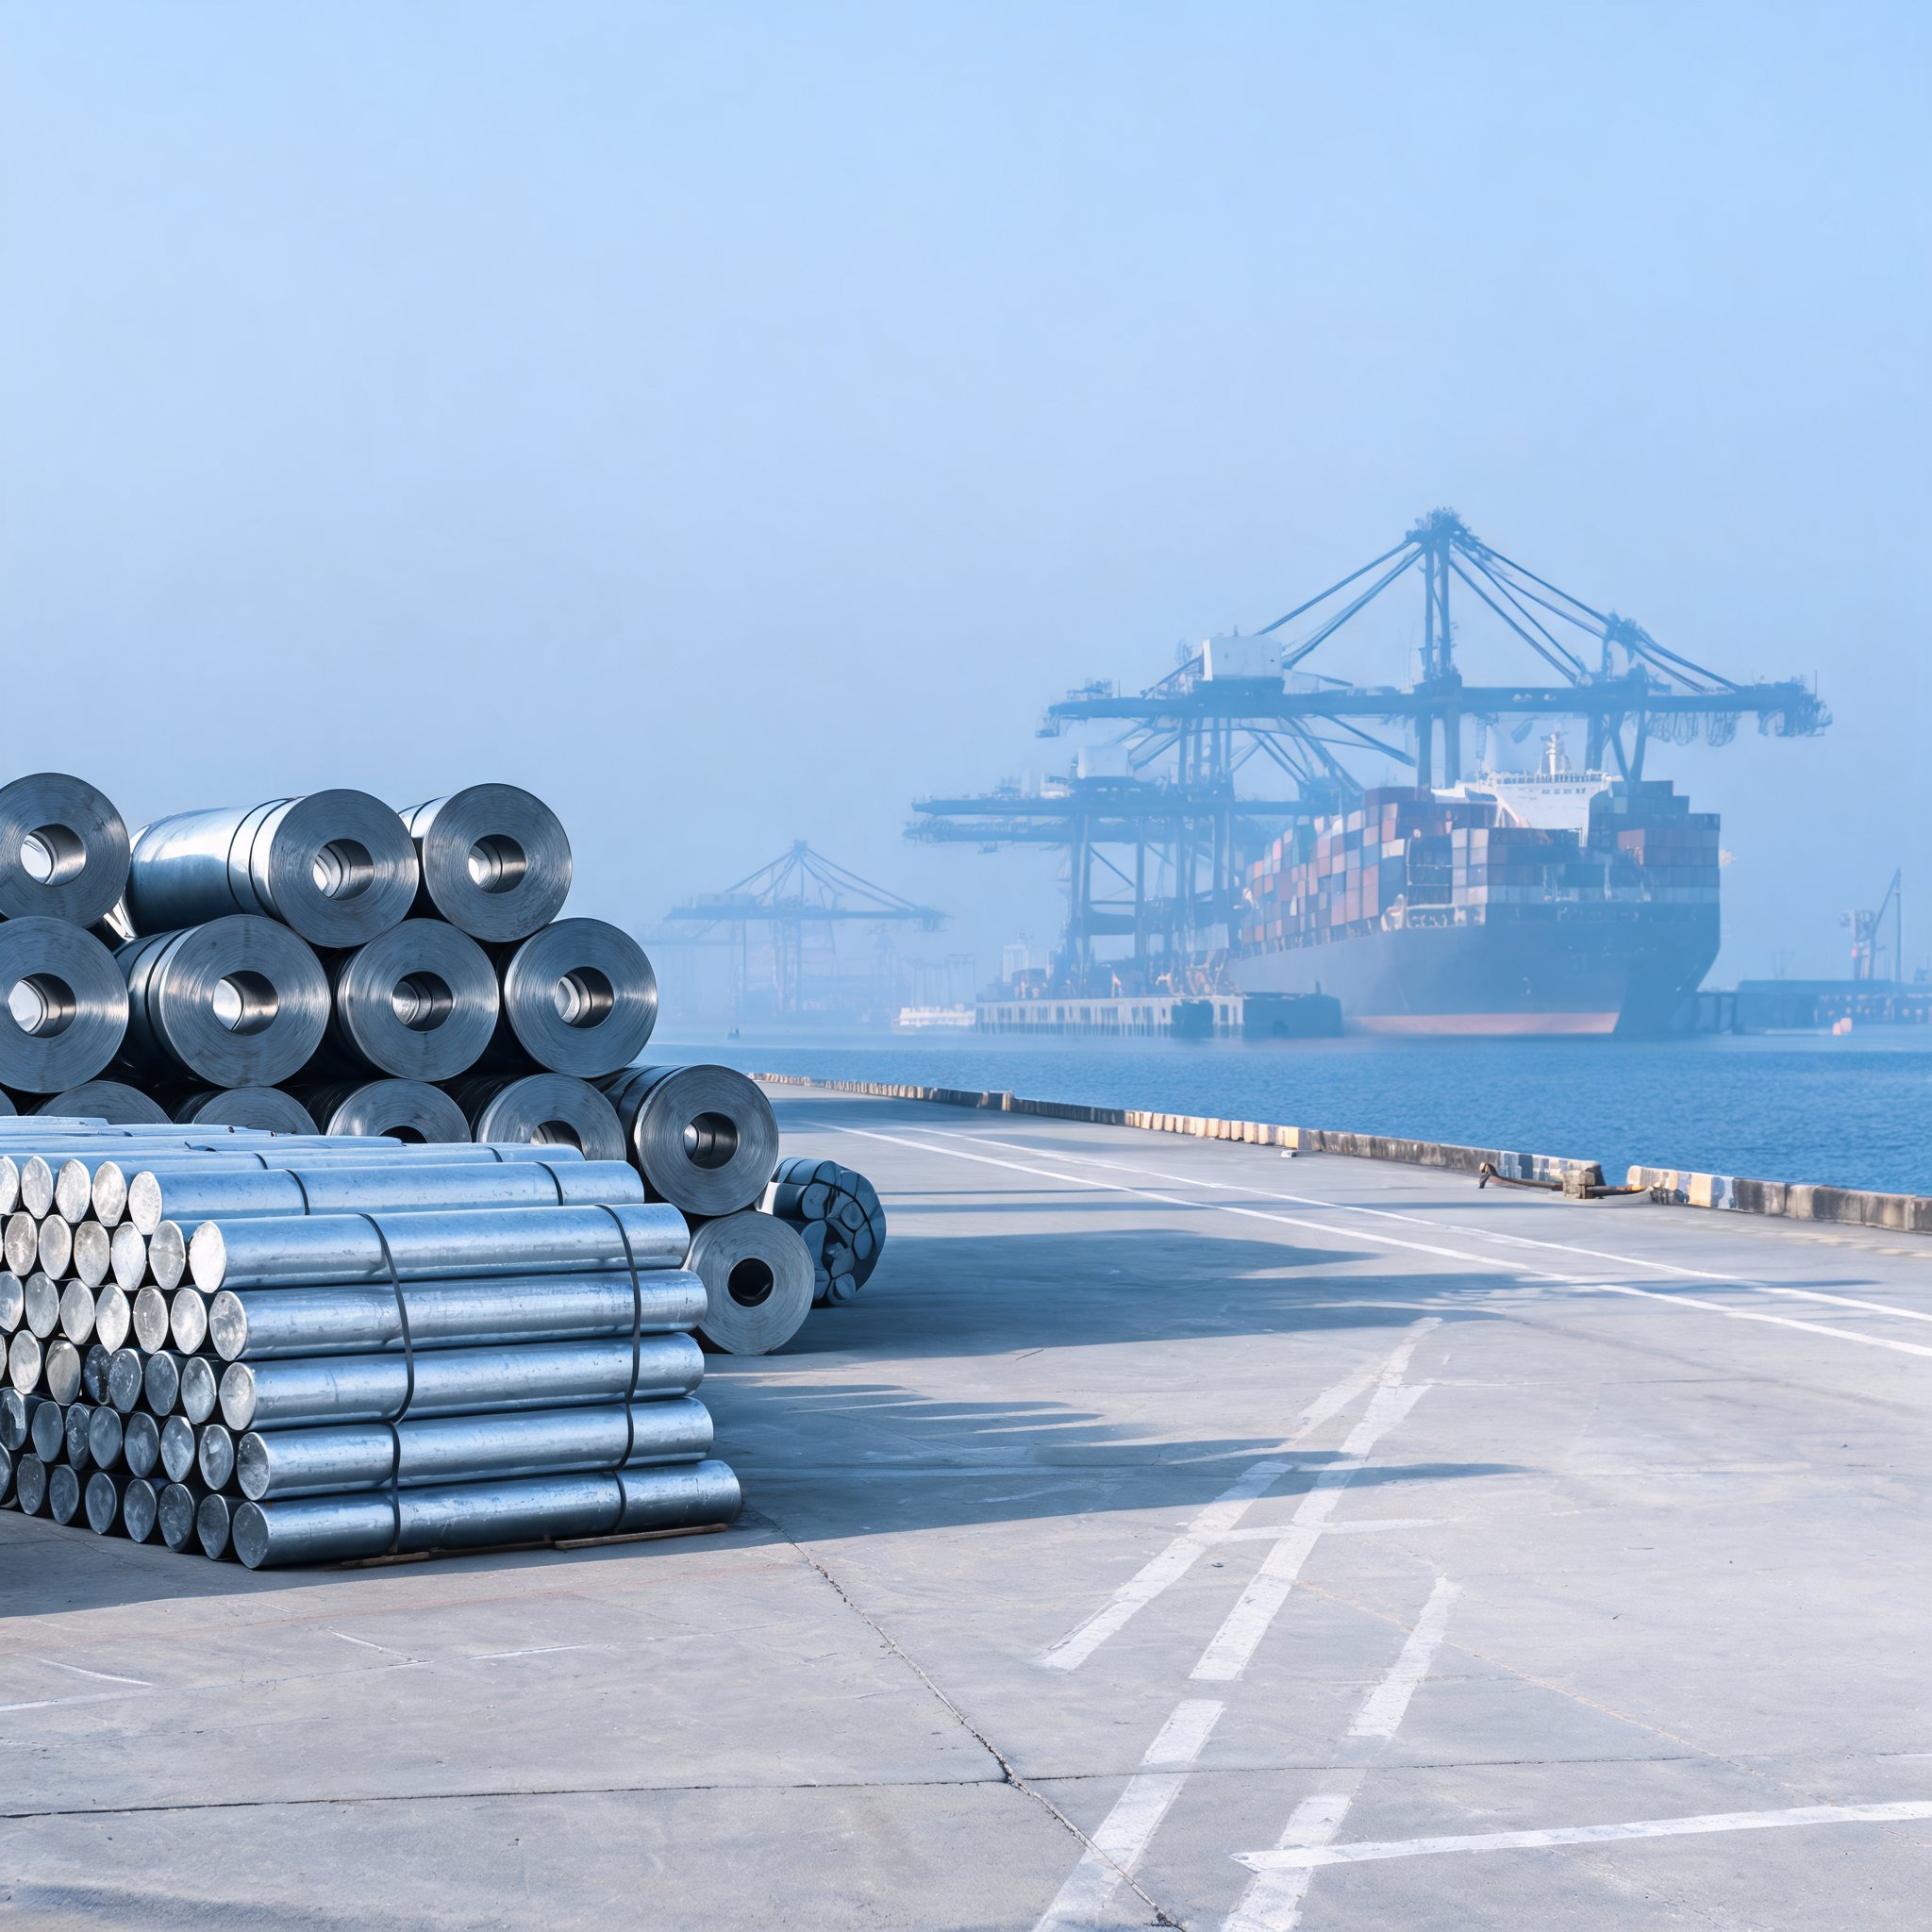
Japan imported 1.36 million tonnes of downstream aluminium products in January–August 2026, 6.2 per cent below the 1.45 million tonnes recorded in the same period of 2025. The roughly 90,000-tonne decline came alongside a reshuffle among the five leading suppliers: the UAE posted the steepest fall of the group, while Australia became Japan's largest source of the metal.
Annual totals have stayed close to flat
The partial-year comparison sits against three years of near-stable annual imports. Japan took in 2.11 million tonnes in 2023 and 2.12 million tonnes in 2024, an increase of 0.3 per cent, followed by a further 0.1 per cent rise to 2.12 million tonnes in 2025. The January–August figures cover only part of the year, so they do not by themselves establish a change in the full-year trend.
UAE: lower volumes, lower spending
The UAE was the largest of the five suppliers in January–August 2025 at 269,815 tonnes, but slipped to second place a year later as shipments fell to 157,022 tonnes, a drop of 41.8 per cent. Spending on UAE material moved in the same direction but less sharply, from about USD 758 million to USD 517 million, down 31.8 per cent. Because the fall in value was smaller than the fall in tonnage, the average value of a tonne shipped from the UAE was higher in 2026 than a year earlier.
Australia takes the top position
Australia moved up from second place to first, even though its shipments declined from 256,366 tonnes to 236,695 tonnes, a fall of 7.7 per cent. Import value went the other way, rising from about USD 710 million to USD 825 million, an increase of 16.2 per cent. The contrast is the mirror image of the UAE result: Australia supplied less metal for more money, while the UAE supplied less for less. Together the two countries delivered 393,716 tonnes in January–August 2026, against 526,182 tonnes a year earlier, a combined decline of 25.2 per cent.
Brazil and China add volume, Malaysia holds
Brazil's shipments rose from 104,916 tonnes to 120,121 tonnes, up 14.5 per cent. China recorded the largest proportional gain, climbing from 89,735 tonnes to 138,214 tonnes, an increase of 54 per cent, and moving from fifth to third place among the five suppliers. Malaysia was essentially unchanged at 115,258 tonnes, compared with 115,841 tonnes a year earlier, a decrease of 0.5 per cent.
What the figures do and do not show
The data describe a reallocation among suppliers rather than a simple shrinking of the import book. Based on the reported country totals, the five countries listed supplied about 767,000 tonnes in January–August 2026, roughly 69,000 tonnes less than in the same months of 2025, while the overall import figure of 1.36 million tonnes covers a wider group of origins. The largest single movement was the loss of UAE tonnage, only part of which was offset by higher Australian, Chinese and Brazilian shipments.
The figures do not attribute the shifts to particular causes, and the release sets out no pricing, contract or trade-policy explanation for the change in supplier rankings. Nor does it break the volumes down by product form within the downstream category. Read against the stable annual totals of 2023 to 2025, the January–August comparison is best treated as a picture of how the supplier mix moved within a broadly steady import market, pending full-year 2026 data.